
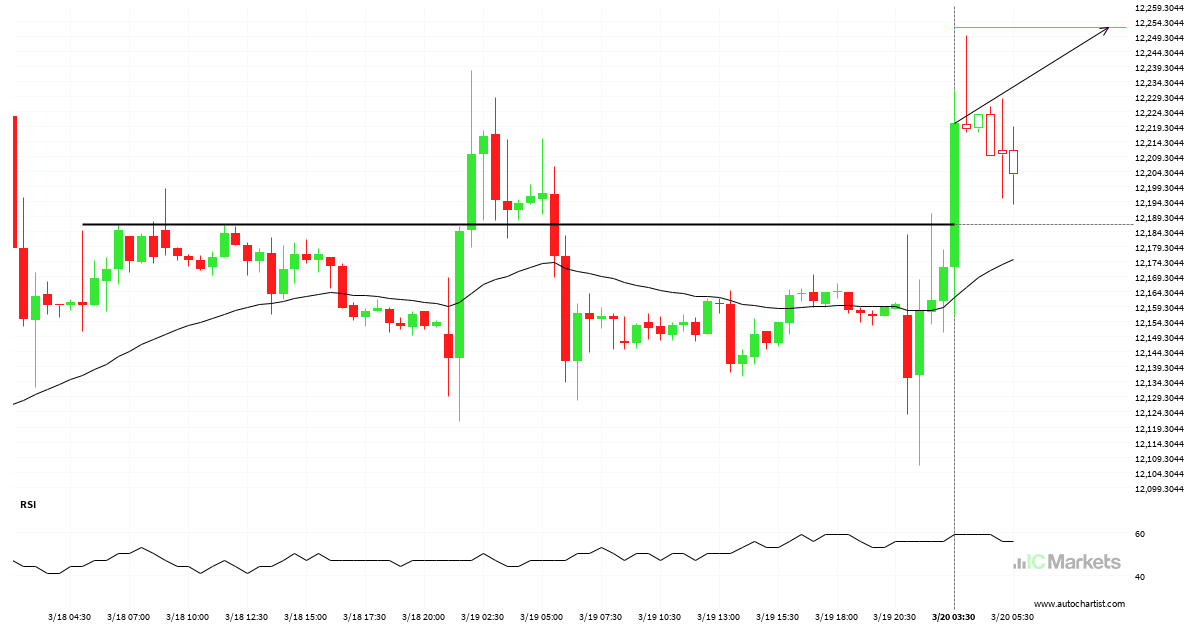
FTSE China A50 Index – psychological price line breached
FTSE China A50 Index has breached the resistance line at 12186.6904. It may continue the bullish trend towards 12252.0342, or, it may prove to be yet another test of this level.
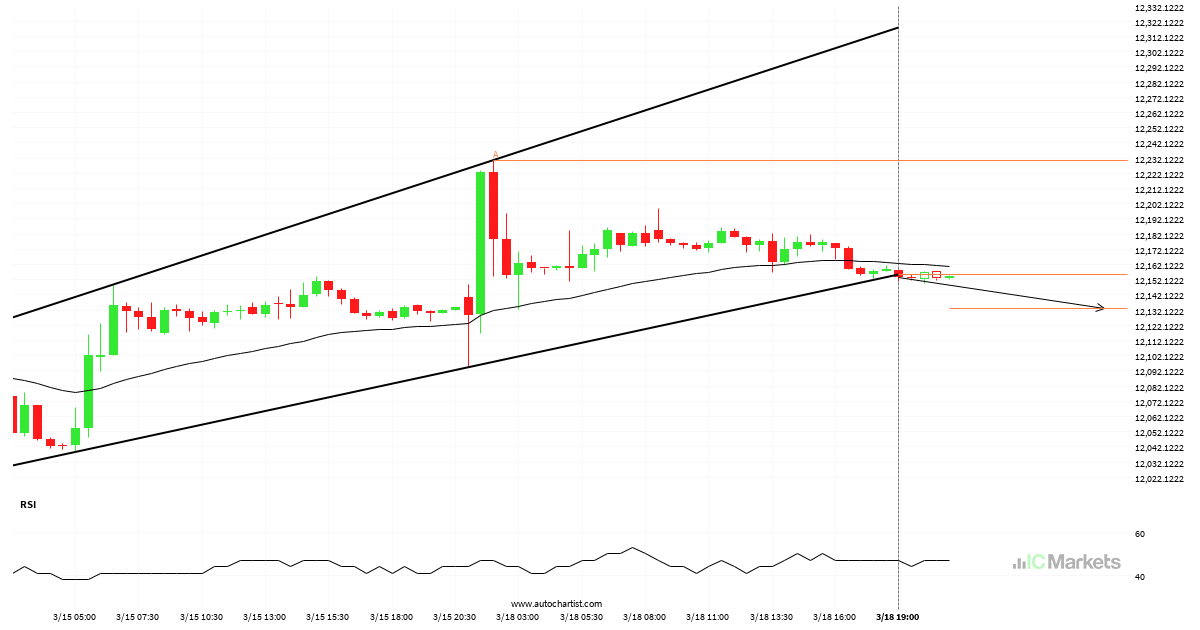
FTSE China A50 Index has broken through support
This trade setup on FTSE China A50 Index is formed by a period of consolidation; a period in which the price primarily moves sideways before choosing a new direction for the longer term. Because of the bearish breakout through support, it seems to suggest that we could see the next price move to 12132.8958.
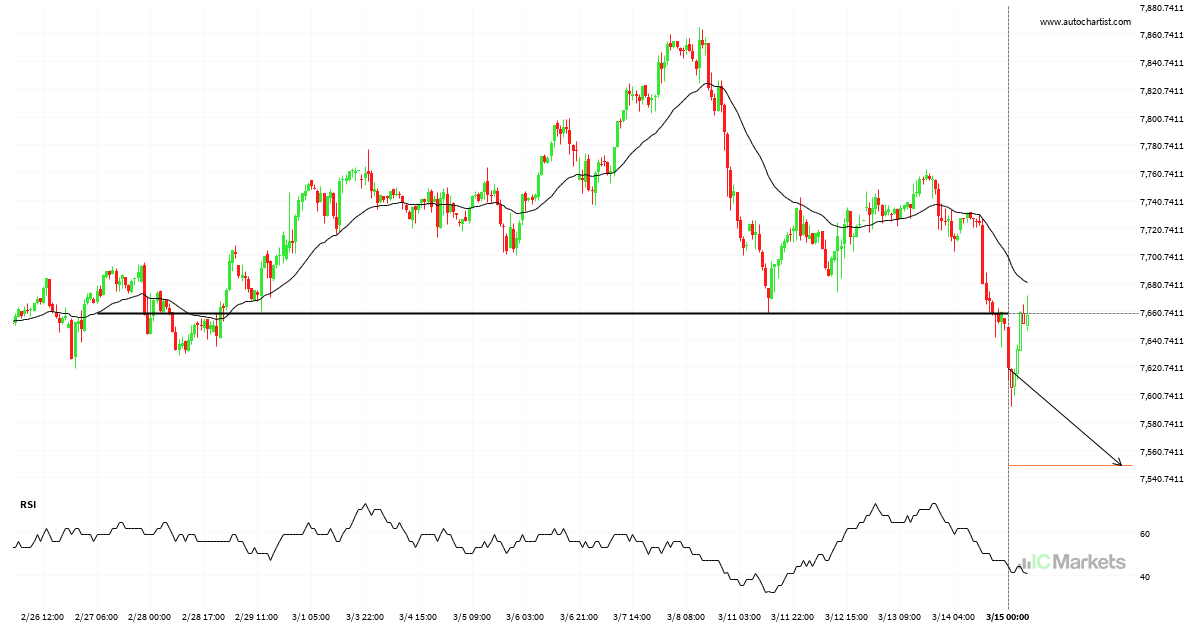
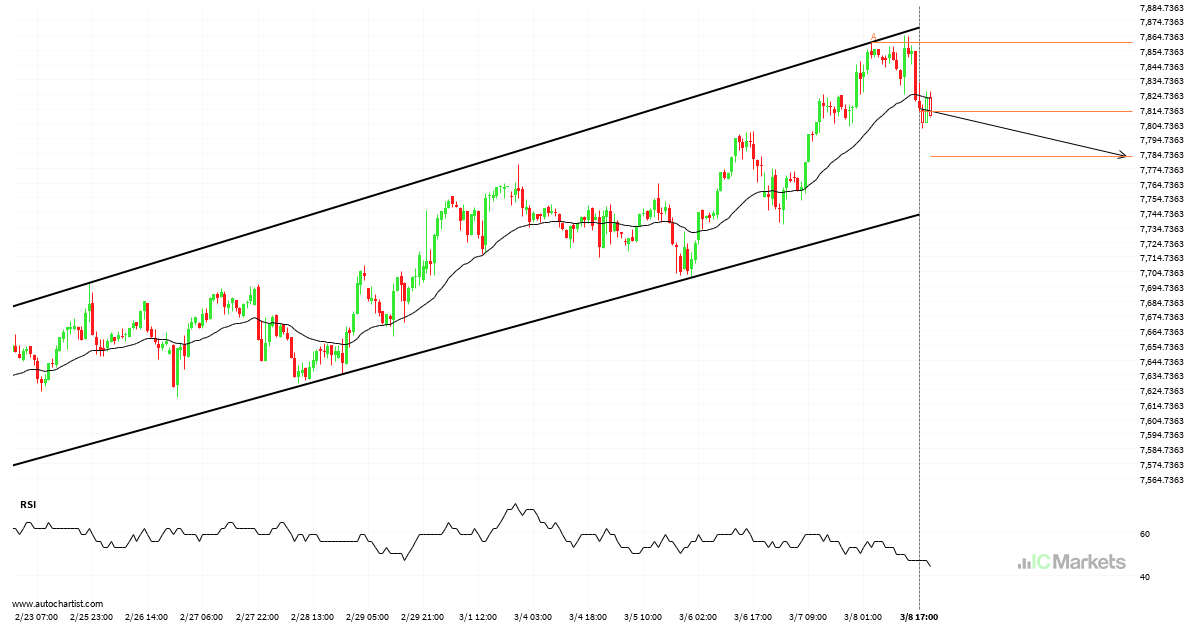
Support breakout on Australia 200 Index
Australia 200 Index has breached the support line at 7659.3398. It may continue the bearish trend towards 7549.9678, or, it may prove to be yet another test of this level.

FTSE China A50 Index is on the approach
FTSE China A50 Index is en route to a very important line that will be a definite deciding factor of what is to come! We may see this trajectory continue to touch and break through 12241.2002, unless it runs out of momentum and pulls back to current levels.
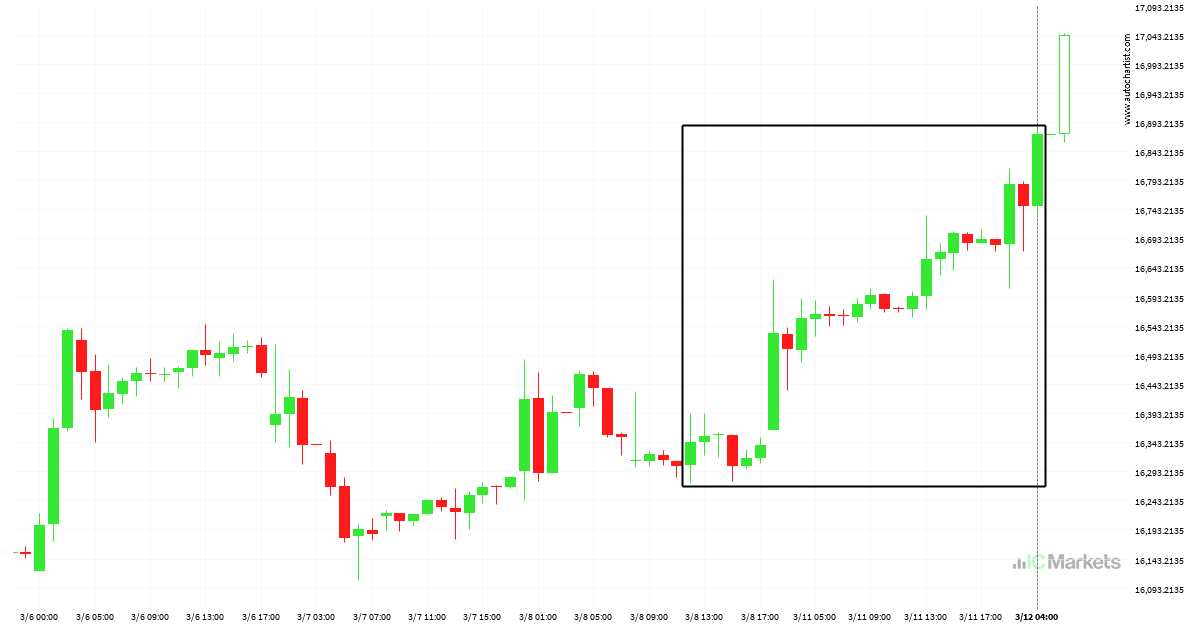
Will Hong Kong 50 Index bounce after a massive rise?
Hong Kong 50 Index rose sharply for 4 days – which is an excessively big movement for this instrument; exceeding the 98% of past price moves. Even if this move is a sign of a new trend in Hong Kong 50 Index there is a chance that we will witness a correction, no matter how […]
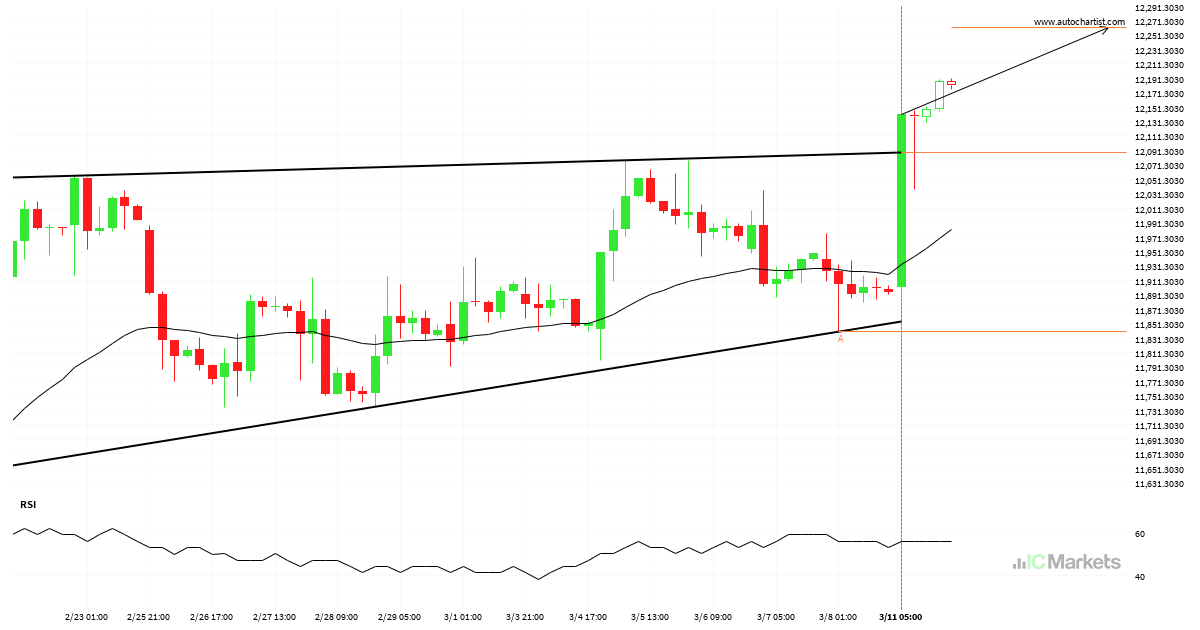
Resistance line breached by FTSE China A50 Index
The last 26 4 hour candles on FTSE China A50 Index formed a Ascending Triangle pattern and broken out through the pattern lines, indicating a possible bullish movement towards the price level of 12261.0186.

Resistance breakout on Hong Kong 50 Index
Hong Kong 50 Index has broken through a line of 16487.0195. If this breakout holds true, we could see the price of Hong Kong 50 Index heading towards 16638.7637 within the next 3 days. But don’t be so quick to trade, it has tested this line numerous times in the past, so you should probably […]
Possible breach of support level by Australia 200 Index
Australia 200 Index is heading towards the support line of a Channel Up and could reach this point within the next 3 days. It has tested this line numerous times in the past, and this time could be no different from the past, ending in a rebound instead of a breakout. If the breakout doesn’t […]
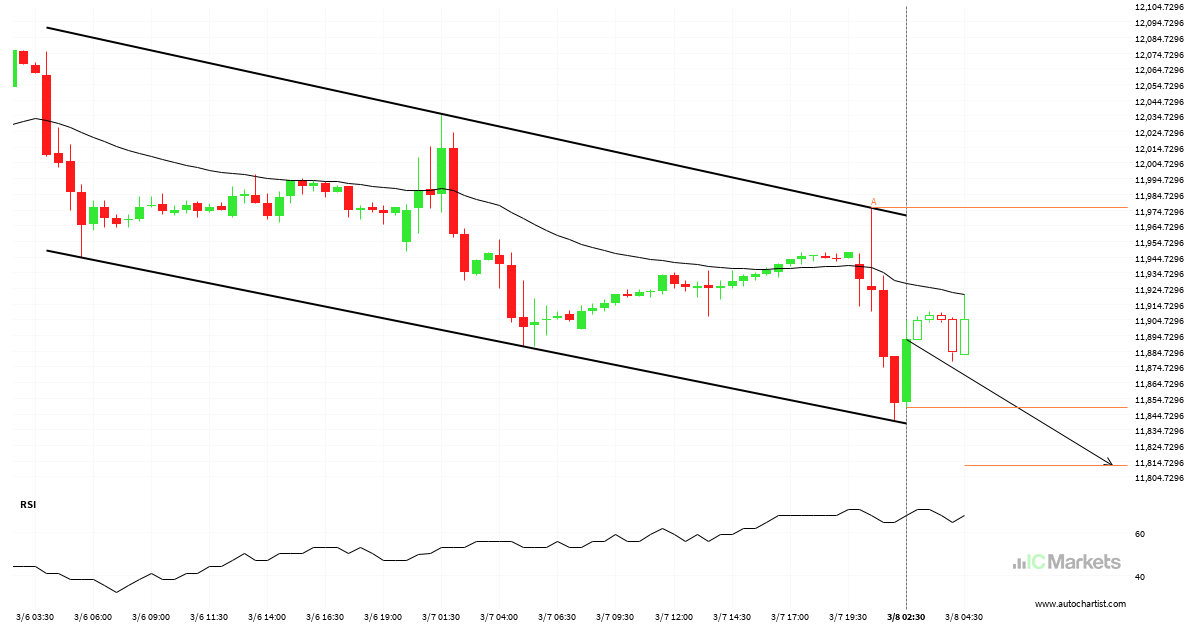
FTSE China A50 Index – getting close to support of a Channel Down
Emerging Channel Down detected on FTSE China A50 Index – the pattern is an emerging one and has not yet broken through resistance, but the price is expected to move up over the next few hours. The price at the time the pattern was found was 11849.22 and it is expected to move to 11812.1789.

Big movement possible on FTSE China A50 Index
FTSE China A50 Index has broken through a support line. Because we have seen it retrace from this price in the past, one should wait for confirmation of the breakout before trading. It has touched this line numerous times in the last 14 days and suggests a possible target level to be around 11803.9063 within […]